
The Data Fluency Framework
Higher and Further Education institutions are saturated with data.
The Data Goddess Data Fluency Framework is designed specifically for Higher and Further Education leaders who want to strengthen decision-making, not simply increase reporting.
Data fluency is not a technical skill. It is a professional capability. It is made up of the following three elements:
Communication
Learning how to ask better questions of your data, if something is unclear, that might mean there is confusion about the question being asked, what assumptions have been made or something is missing.
Context
Our data goes through a long journey before it gets to its final form in a meeting or committee. At any stage on this journey, it can undergo changes that distort what meaning you can get from it – understanding the context is important for interpretation.
Confidence
You don’t need perfect data, you need the confidence to be able to make decisions using it. It’s not about having the right answers, it’s knowing when the answers you have are not yet good enough.
The Data Fluency Spectrum
The Data Goddess Data Fluency Framework is built around a developmental spectrum.
Data capability is not binary. Institutions are not simply “good with data” or “bad with data”. Instead, individuals and organisations move along a continuum.
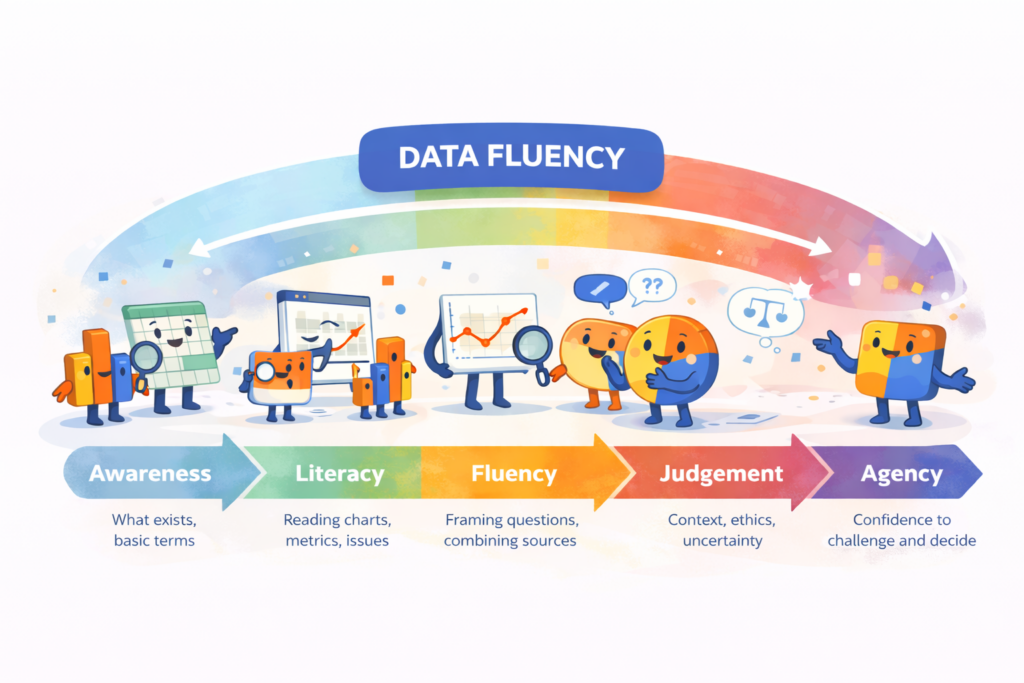
At its simplest, data fluency progresses through five stages:
Awareness → Literacy → Fluency → Judgement → Agency
This spectrum does not describe technical ability. It describes professional maturity in working with data.
Most organisations operate comfortably in the first two stages.
The greatest leadership risk sits between Fluency and Agency.
Awareness
Awareness is foundational. It includes knowing:
- What data exists within the institution
- What key metrics are used
- The language and terminology associated with reporting
At this stage, individuals can recognise data artefacts such as dashboards, KPIs, benchmark reports and regulatory datasets.
However, awareness alone does not equip someone to interpret or challenge what they see.
Leadership risk if capability stops here:
Decisions are made based on surface recognition of numbers without interrogation of meaning.
Signs your organisation is operating primarily at Awareness
- Staff feel hesitant to ask basic questions
- Metrics are referenced but rarely explained
- Terminology is assumed rather than clarified
- Dashboards are circulated without discussion
Literacy
Literacy builds on awareness. It involves the ability to:
- Interpret charts and tables accurately
- Identify obvious inconsistencies or anomalies
- Understand how benchmarks and comparators function
- Recognise trends over time
Data-literate professionals can “read” the data correctly.
But literacy is still reactive. It answers the question:
“What does this chart say?”
It does not yet ask:
“Is this the right question?”
Leadership risk if capability stops here:
The institution becomes highly competent at reporting but weak at reframing problems.
What literacy does not guarantee
- Confidence to challenge definitions
- Understanding of how the data was constructed
- Awareness of proxy measures
- Recognition of hidden assumptions
Fluency
Fluency marks the shift from reading data to working with it.
Fluent professionals:
- Frame sharper questions
- Combine multiple data sources
- Identify gaps in available information
- Recognise when a metric only partially represents reality
This is the point where professionals begin to see data as constructed rather than objective.
Fluency introduces productive discomfort.
It is the recognition that:
- Every metric simplifies
- Every dataset reflects choices
- Every dashboard contains omissions
Leadership opportunity at this stage:
Fluency strengthens institutional learning and reduces simplistic decision-making.
Practical examples of fluency in action
- Asking whether missing data is random or meaningful
- Questioning what “engagement” actually measures before triggering intervention
- Examining continuation metrics alongside student support capacity
- Cross-referencing NSS outcomes with demographic context
Judgement
Judgement is where technical competence becomes leadership maturity.
At this stage, professionals:
- Explicitly acknowledge uncertainty
- Understand contextual drivers behind metrics
- Recognise ethical implications of data use
- Distinguish between signal and noise
Judgement prevents overconfidence.
In regulatory and AI-driven environments, this is critical.
A metric can be accurate and still misleading.
Judgement is the ability to hold that tension.
Leadership risk if judgement is weak:
Metrics become targets. Proxy measures drive behaviour. Complex realities are reduced to single percentages.
What judgement looks like in senior leadership
- Distinguishing between performance management and student support
- Asking what would change if this metric were wrong
- Challenging whether an indicator reflects quality or merely compliance
- Resisting pressure to automate high-stakes decisions
Agency
Agency is the culmination of data fluency.
Agency means:
- Professionals feel authorised to question metrics
- Leaders welcome interrogation rather than silence
- Decisions are made transparently, not defensively
- Data informs judgement rather than replaces it
Agency does not mean rejecting data.
It means using it responsibly.
The absence of agency is visible when:
- Data ends discussion
- Staff hide behind numbers
- Risk is avoided by deferring to dashboards
The presence of agency is visible when:
- Assumptions are surfaced
- Decisions are proportionate
- Uncertainty is acknowledged
- Accountability is retained
In an AI-enabled environment, agency is the safeguard against both automation bias and institutional paralysis.
Where Data Gets Distorted
Distortion in higher and further education rarely begins with a misleading chart or a poorly designed dashboard. It begins much earlier, at the point where definitions are set and data is first collected. Every metric rests on choices about what counts and what does not, whether that is continuation, engagement, success or even who qualifies as a student. In regulated environments some of these definitions are externally prescribed, others are internal conventions that have simply endured. Add to that the realities of system design, process compliance, human interpretation and timing constraints, and it becomes clear that data is shaped long before it is seen. If leaders are unaware of those foundations, they risk arguing about performance while missing the deeper question of what the metric actually represents.
As data moves through institutions it is migrated, mapped, transformed and aggregated. Fields are aligned between systems, codes are translated, assumptions are embedded into logic, and percentages replace individual experiences. These processes are technically necessary, but they introduce conceptual drift. Over time, institutional memory of how a metric is constructed fades, even as confidence in its precision grows. Aggregation further simplifies complexity, smoothing out volatility in small cohorts, masking differential outcomes and concealing structural constraints. The result is not necessarily inaccurate data, but data that carries hidden compromises and trade-offs.
The so what is this: in highly regulated sectors such as HE and FE, metrics do not merely describe performance, they shape it. Funding, reputation and regulatory judgement increasingly hinge on quantified indicators. When a proxy becomes a target, behaviour adjusts to meet it. Practice shifts, and the data shifts with it, creating a self-reinforcing loop. Without data fluency that loop remains invisible, and governance becomes reactive rather than deliberate. With fluency, leaders can interrogate definitions, understand limitations, and challenge framing before metrics harden into unquestioned truths. That is the difference between being managed by data and governing through it.

Data Fluency in the Age of AI
Artificial intelligence does not replace the need for data fluency. It amplifies it.
AI systems accelerate analysis. They summarise, predict, cluster, and recommend at a speed no human team can match. But they do not understand institutional context. They do not carry professional accountability. They do not experience the consequences of decisions. AI increases analytical capacity. It does not increase judgement.
Without fluency, institutions risk two unhelpful extremes:
- Over-trust in automated outputs
- Blanket rejection of AI-generated insight
Both are failures of professional maturity. Data fluency provides the middle ground. It enables leaders to:
- Interrogate AI outputs rather than defer to them
- Recognise when a model is reflecting historical bias
- Distinguish between statistical significance and educational significance
- Decide proportionately, rather than automatically
In this sense, fluency is not anti-AI. It is what makes AI usable. As analytics becomes more automated, the human responsibility to interpret, contextualise, and decide becomes more visible, not less.

Embedding Data Fluency Across the Institution
Data fluency does not emerge because a dashboard improves. It develops because behaviours shift. Institutions that strengthen fluency tend to do three things consistently.
1. They Legitimate Questioning
In fluent institutions, questioning a metric is not seen as resistance. It is seen as professionalism. Leaders model this by asking:
- What assumptions sit behind this indicator?
- What would change our interpretation?
- What does this number not tell us?
2. They Surface Definitions Explicitly
Metrics often fail not because they are incorrect, but because they are misunderstood. Fluent institutions invest time in making definitions visible:
- Clarifying what continuation actually measures
- Explaining how engagement data is constructed
- Distinguishing between regulatory compliance and educational quality
3. They Recognise That Culture Matters
Technology can be purchased. Process can be documented. Fluency is cultural. It develops when:
- Leaders reward thoughtful challenge
- Data professionals are seen as partners, not report generators
- AI tools are adopted with deliberation rather than enthusiasm alone
- Professional judgement is protected rather than displaced
Data fluency is not a training session. It is a capability shift. But it can begin with a structured conversation.

How I Work With Organisations on Data Fluency
This Data Fluency Framework cannot be embedded through reporting improvements alone. It requires structured reflection, leadership engagement, and deliberate cultural shifts.
My work with institutions typically falls into four areas.
Leadership Conversations
I work with senior leadership teams to:
- Explore how key institutional metrics are currently interpreted
- Surface unexamined assumptions within performance reporting
- Strengthen confidence in holding uncertainty
- Clarify where AI-generated or automated analytics require additional scrutiny
These sessions are not technical. They are strategic.
Data Teams Development
I support data teams to:
- Reframe their role from report production to insight partnership
- Strengthen their confidence in challenging proxy measures
- Embed contextual commentary into dashboards and reports
- Navigate the tension between compliance and interpretation
This strengthens both capability and credibility.
Governance and Reporting Reviews
I review:
- Reporting structures
- Metric definitions
- Escalation triggers linked to performance indicators
- The integration of AI or predictive analytics into decision cycles
The focus is not on replacing systems.
It is on strengthening interpretive safeguards.
Mentoring and Technical Training
Fluency is not only institutional. It is personal. Through mentoring and facilitated development sessions, I support:
- Early-career data professionals
- Heads of Planning and Registry
- Quality and compliance leads
- Senior managers transitioning into data-heavy roles
The focus is on strengthening confidence, sharpening judgement, and building agency.