When I started working with data in higher education, my tools of choice were Excel and Access. My first real project was back in 2003, fixing a clunky admissions database that someone in the department had cobbled together in Access. Once I got it running more smoothly and set it up to accept data uploads instead of manual input, I was hooked. I didn’t call myself a data analyst back then, but that’s exactly what I was becoming.
Fast-forward to now, and I’m using Power BI, Dataverse, and even experimenting with ChatGPT to support data analysis. The toolkit has changed, and with it, the expectations. But what hasn’t changed is the core mission: making data useful.

The Tools That Got Us Here
Excel is still everywhere – and for good reason. It’s flexible, accessible, and everyone in HE seems to speak its language. And SQL? Still the backbone for getting anything out of a database. These tools form the foundation for most of the work university data teams do today.
Power BI was the game-changer for me. For the first time, I could give academics and senior managers dashboards that looked professional and polished – and importantly, they couldn’t accidentally break them like they might with a shared Excel file. It shifted the conversation from “where’s the data?” to “what can we do with it?”
What’s Changing
Now, AI is entering the mix. I’ve started experimenting with tools like ChatGPT to help with data analysis: summarising results, generating code snippets, even writing documentation drafts. In parallel, platforms like Power BI have started baking in AI visuals and natural language querying.
There’s a shift happening. Not everyone needs to become a data scientist, but we do need to become AI-aware. That means understanding what AI can help with (free-text responses, pattern recognition, repetitive tasks), and just as importantly, what it can’t fix (messy data, inconsistent definitions, missing context).
A Roadmap for Growing Your Toolkit
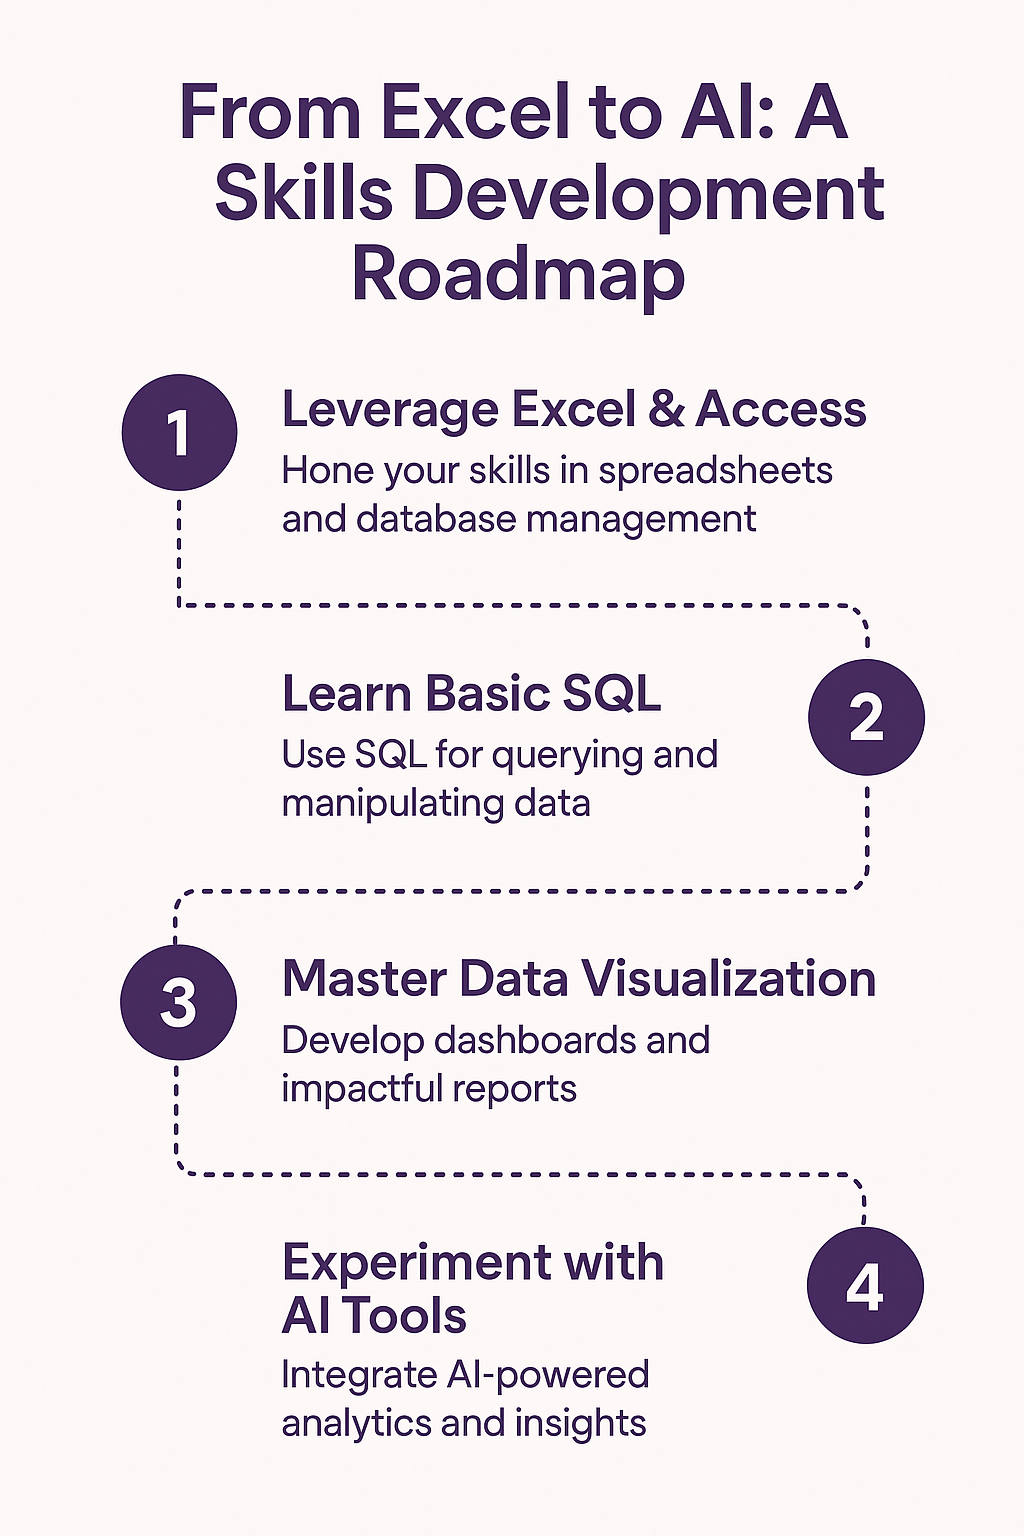
So, what should the modern university data analyst be learning? Here’s how I see it:
1. Build a strong foundation. Be confident in Excel, pivot tables, lookup functions. Know your way around a database and be comfortable writing SQL. These basics still carry most of the weight.
2. Learn to visualise and communicate. Tools like Power BI or Tableau aren’t just about dashboards – they’re about helping people see the story in the data. Understanding design and user experience matters.
3. Start exploring automation and scripting. Python or R can help you automate repeatable tasks or analyse large datasets more efficiently. But even small wins – like using Power Query or DAX in Power BI – make a big difference.
4. Get AI-aware. You don’t need to train your own models. But it’s worth playing with AI tools to see how they might support your workflow. Think of them as an assistant: helpful, but not yet trustworthy on their own.
5. Never stop learning. I’ve never waited for formal training. Most of what I know has come from online courses, YouTube videos, blogs, and just trying things out. That mindset – curious, practical, self-driven – is what really matters.
Making Data Fit for Purpose
The HE sector is testing the waters with AI, some institutions more confidently than others. But there’s still a long way to go when it comes to data quality and governance. That’s where the work starts, and where it still needs the most attention.
Right now, my mission is simple: make data fit for purpose. Everything else – from basic reports to AI-powered insights – depends on that.
So whether you’re still deep in Excel, starting to explore Power BI, or building your first AI-assisted tool, keep learning. Your toolkit will evolve. Your judgment and curiosity will always be the most powerful tools you have.